

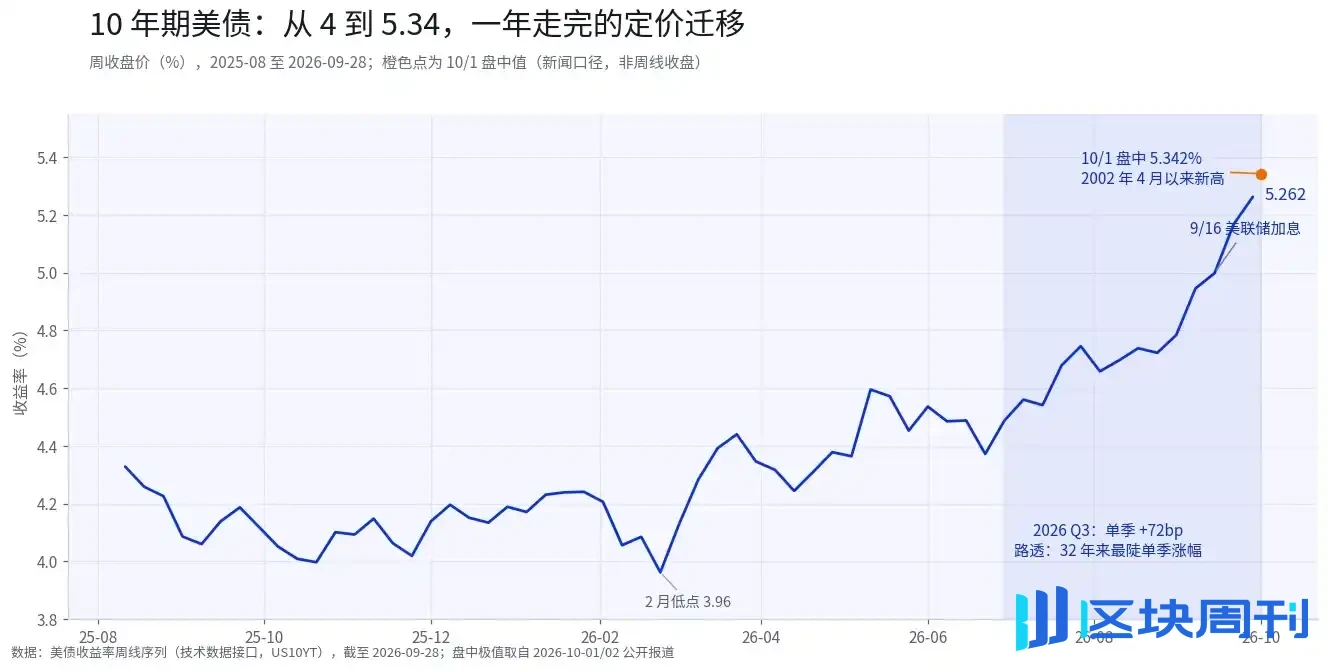
One-sentence conclusion: The 10-year U.S. Treasury yield surged to 5.34%, a new high since 2002, and posted the steepest quarterly rise in 32 years in Q3. This selloff is compounded by three forces—repricing of policy credibility, supply pressure from the interest bill, and the amplifying effect of crowded positioning. This article takes the rise in U.S. Treasury yields as an entry point, focusing on its transmission to stocks, funding markets, crypto assets, and related expression tools: in Q3, BTC and Treasury yields rose together in a rare occurrence, with capital inflows temporarily overpowering discount rate pressure; while over the past year, the returns of six expression tools for "bullish on Bitcoin" have all converged toward BTC itself. This article is a compilation of public information and industry observation, and does not constitute any investment advice.
On October 1, the 10-year U.S. Treasury yield broke above 5.34% intraday, surpassing the 2007 high and returning to the highest level since 2002; the 30-year hit its highest since 2002 on the same day, and on October 2 it was quoted at 5.63%. Reuters gave an even harsher characterization: this was the steepest quarterly rise in 32 years.
Yet the market at the close appeared calm. The Dow closed at 50,926.56, up 0.04%; the S&P 500 rose 0.19%; the Nasdaq rose 0.04%. The indices recovered from an intraday drop of nearly 1%, Accenture soared 16% on AI orders, and the optical communications sector collectively exploded.
The bond market set a historical record, while the stock market shrugged at the close. This contrast itself is a signal: the market does not believe that rising yields equal doomsday for risk assets, but it also does not believe they are irrelevant. The real question is—who is selling, and what is being sold.
I. First, the numbers
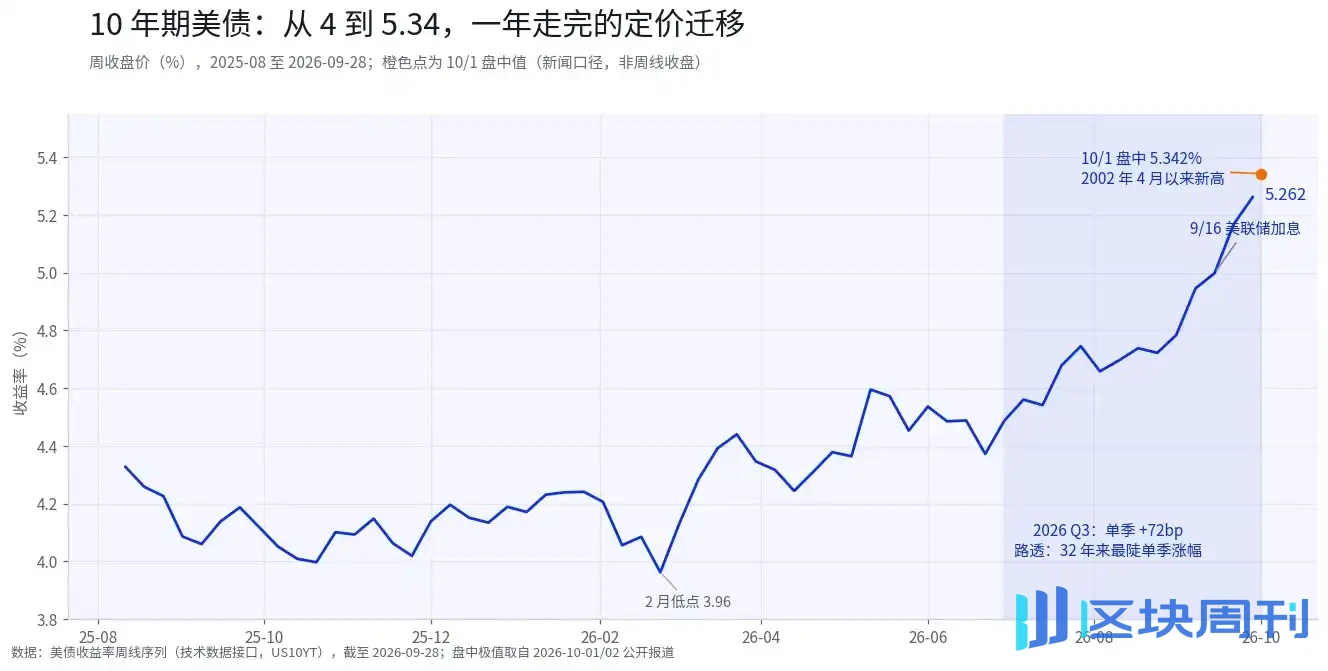
From August 2025 to February 2026, the 10-year yield hovered around 4% for more than half a year, with a low of 3.96%. It began to rise in March and accelerated noticeably in Q3: in mid-July it was still 4.54%, and in the week of September 28 it closed at 5.262%, up about 72bp for the quarter. After the Fed raised rates on September 16, yields did not fall back, and in the last week of September they rose another 26bp, touching 5.342% intraday on October 1. On October 2 during Asian hours, they edged down to around 5.26%, which Reuters described as "some buyers returning after the bond decline."
The 30-year was more volatile. According to BTIG, in just 7 trading days, the 30-year yield rose from 5.25% to 5.69%, a cumulative increase of 44bp; during the same period, the Daily Sentiment Index (DSI) for bonds fell to 10%, an extremely pessimistic range. On October 2, the 30-year closed at 5.623%.
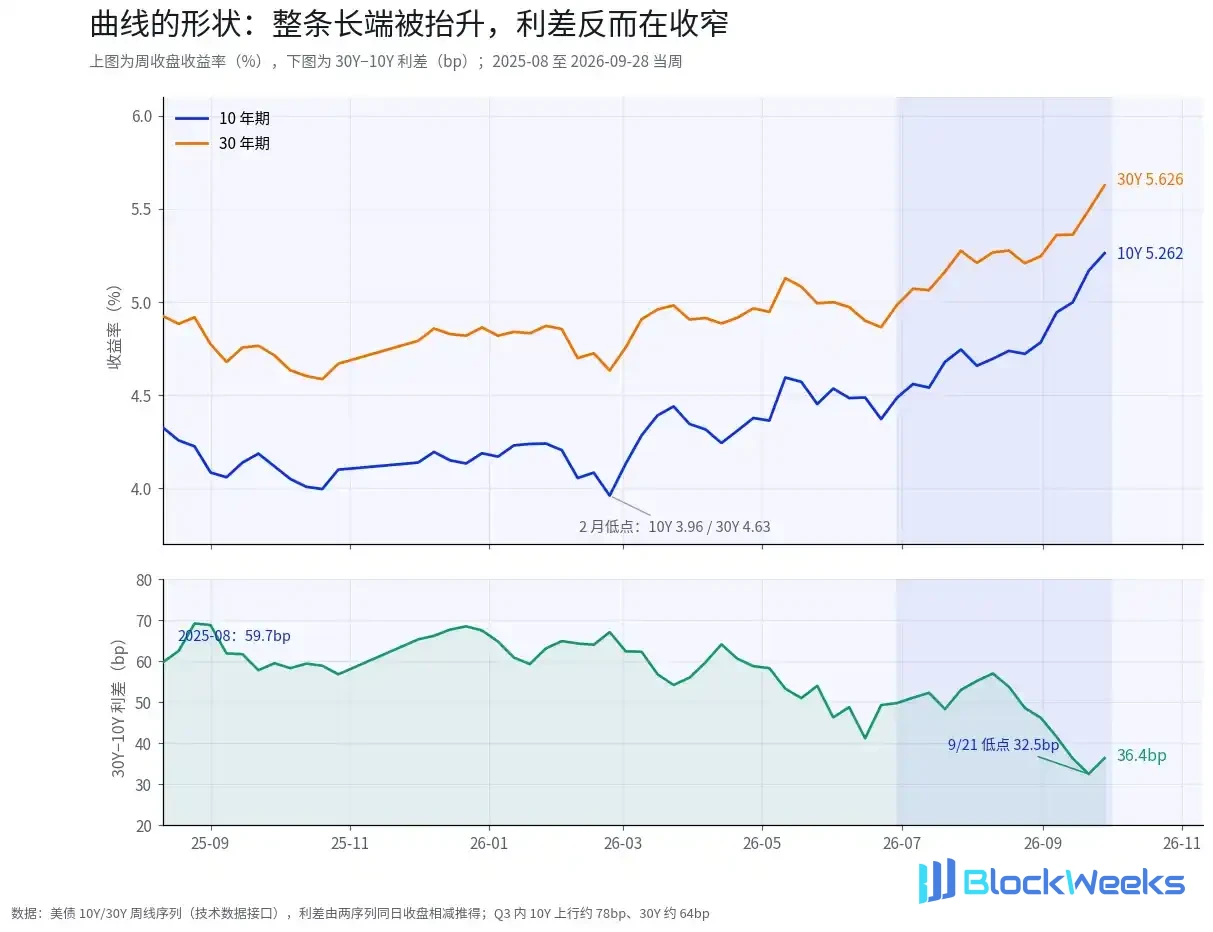
The curve shape contains more information. Within Q3, the 10-year rose about 78bp, the 30-year about 64bp, and the 30Y-10Y spread did not rise but fell, narrowing from 50bp to 36.4bp, and on September 21 it was as low as 32.5bp. This is not a steepening of the "long end panicking alone" type, but rather closer to the entire long end being lifted in sync—the focus of market repricing may no longer be "how many more times the Fed will hike," but "how much compensation is required to hold long-term U.S. dollar debt."
This is not a market unique to the United States. On the same day, October 1: the U.K. 30-year gilt yield touched 6%, the first time since March 1998; French government bond yields hit an 18-year high, and the France-Germany 10-year spread widened to 146.68bp, the widest since 2012; Japan's 10-year rose to 3.11%. The yield on the Bloomberg Global Aggregate Treasury Total Return Index rose to the highest since 2000, and global bonds have lost about 2.7% year-to-date.
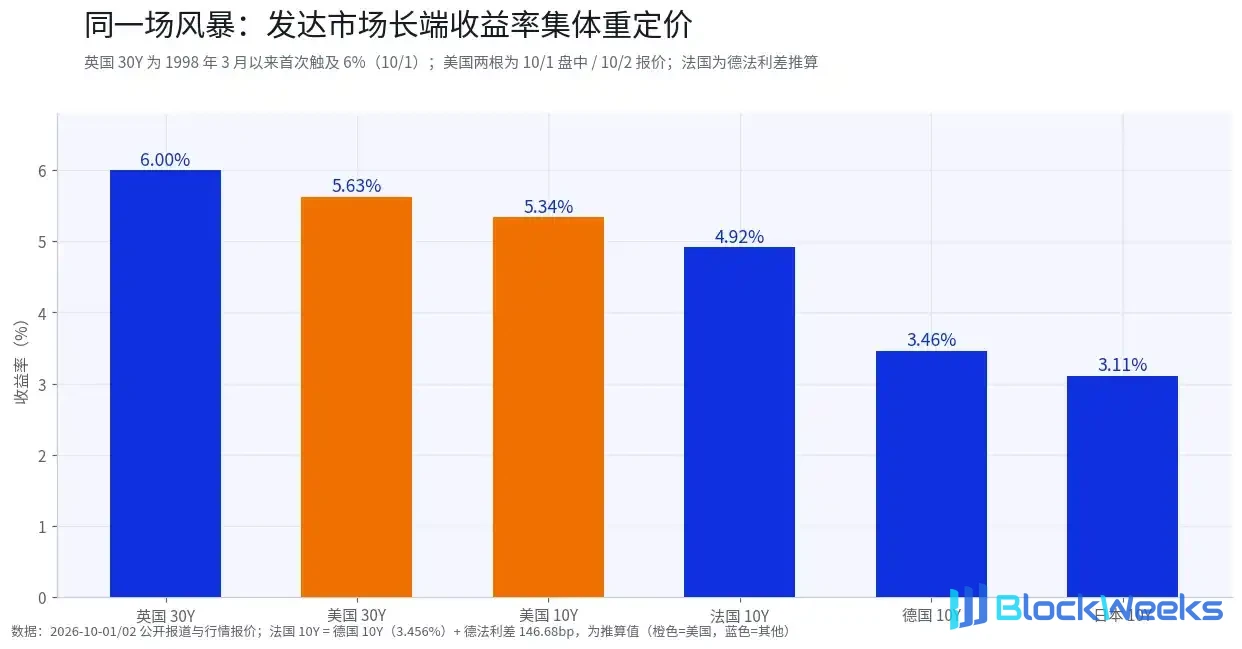
Developed-market sovereign bonds were repriced collectively in the same quarter, which rules out single explanations such as "a policy mistake by one country." The question becomes: what exactly, in the same time window, simultaneously raised the term compensation for all dollar, pound, euro, and yen assets.
II. Who is selling: three explanations, with evidence on the table
There are many explanations on the market for this selloff, and the traceability of the evidence varies greatly. Breaking them down is far more useful than shouting "bond bear market" all together.
Explanation one: Policy credibility is being discounted. After the Fed raised rates on September 16, bond traders were still pricing the possibility of further hikes; the consensus among some asset managers is that weaker employment data may not change this expectation. T. Rowe Price's head of investment-grade bonds said employment needs to be near zero growth or even negative, with wages well below expectations, and "the bar is actually very high." Steven Blitz, chief economist at TS Lombard, proposed a more extreme scenario: if the Fed repeats its "original sin" and turns too early before inflation falls, the 10-year yield could reach 8% in the coming years. 8% is a tail scenario, but its mechanism is worth noting: if a central bank eases before inflation is under control, the market may demand compensation through yields rather than commentary.
Explanation two: Supply and the interest bill. U.S. Treasury interest payments have exceeded $1 trillion this fiscal year. The higher the yield, the more expensive refinancing becomes; the more expensive refinancing, the larger the new issuance; the more new issuance, the higher the compensation required in the next round of pricing. This loop can self-reinforce without relying on sudden events. Global synchronicity provides support for this explanation: the U.K., France, and Japan face the same type of fiscal reality, and the magnitude of yield increases broadly matches the fragility of each country's fiscal space. Four sovereign issuers were required to offer higher compensation in the same quarter, and a single central bank factor is insufficient to explain it.

The chart above is the most direct quantitative evidence for explanation two: in Q3, the U.S. 10-year rose about 77bp, the 30-year about 64bp, Germany's 10-year about 59bp, the U.K. 30-year about 42bp, and Japan's 10-year about 33bp—the magnitudes differ, but the direction is completely consistent.
Explanation Three: Crowded positioning amplifies volatility. According to an October 2 report, a surge in short positions betting on yields continuing to rise is pushing up repo financing costs. This mechanism has self-reinforcing characteristics: the more shorts, the more expensive financing becomes; the more expensive financing, the more covering and stop-losses occur; the more stop-losses, the more likely yields overshoot. Based on this, BTIG's Jonathan Krinsky judges that yields may be near the limit of tactical upside room, with the possibility of a rapid pullback in the short term. The DSI dropping to an extreme reading of 10% is a signal that this force is accumulating conditions for a reversal. It is necessary to distinguish: short positions, repo costs, and DSI are all traceable data, while "crowding leads to overshoot, overshoot breeds reversal" is a mechanism inference.
The three explanations are not mutually exclusive. From existing public data, Explanation Two has relatively more support; Explanation Three more reflects short-term volatility mechanisms; Explanation One can be regarded as one of the tail scenarios, still requiring continued verification from employment data, auction results, and repo spreads. Market divergence also exists as is: those who see 8% tend to treat Explanation One as the trend; bond market veterans who are bullish on US Treasuries for the first time in six years tend to believe that Explanations Two and Three will self-correct. Different positions coexisting at the same price level indicates that long-short divergence near the current position is highly concentrated. Choosing which explanation to believe determines which type of data to watch next.
III. Transmission Path: From Discount Rate to Crypto
The transmission of rising yields to different assets does not go through the same pipeline.

Stocks: Earnings expectations temporarily offset discount rate pressure. The October 1 market provided a sample: yields touched 5.342% intraday, the index fell nearly 1% intraday, then Accenture announced $84.5 billion in full-year new bookings and $22.2 billion in quarterly orders, its stock rose 16%, and major indices narrowed losses to near flat. Discount rate pressure objectively exists, but when earnings expectations are strong enough, the numerator can temporarily offset the denominator. BTIG's different view holds that the change in correlation between yields and the Nasdaq is bidirectional; if yields fall rapidly, the previously concentrated positioning structure may face adjustment, and while market breadth repairs, sectors with concentrated weights may instead weaken. Index volatility is limited, but internal structure may be changing.
Financing market: Repo costs rise. Increased short positions push up repo costs, meaning the financing costs of leveraged funds are rising. The repo market is at the bottom of the dollar leverage system: hedge funds borrowing securities to buy bonds, market makers replenishing inventory, and corporate short-term financing rollovers all depend on this pipeline. This pipeline is also relevant to the crypto market—perpetual contract funding rates, exchange leverage, and stablecoin inflows and outflows are downstream of the same financing conditions. Tension appears first at the repo end, and risk assets feel pressure later.
Hong Kong stocks: HKD pegged to USD, financing cost transmission. The Hong Kong dollar is pegged to the US dollar, so rising US interest rates will transmit to Hong Kong stock valuations through financing costs, with longer-duration growth sectors affected more directly. The Hang Seng Tech Index had a small rebound after the September 16 rate hike, then fell back, closing at 4,157.94 points on October 2, down 2.26% from the previous day. Southbound funds are a buffer variable in this chain: their pace follows more the mainland liquidity cycle rather than dollar pricing. Whether southbound funds can hedge against foreign capital outflow pressure may be an important factor affecting the strength of this transmission chain.

On the daily chart, the Hang Seng Tech Index surged after the Federal Reserve rate hike on September 16, then began to fall back around October; during the Asian session on October 2, it reported 4,144.02 points, down 2.58% (intraday basis, not closed). The buffer variable for Hong Kong stocks is the pace of southbound funds—it belongs to the mainland liquidity cycle and does not fully follow dollar pricing. The strength of this transmission chain depends on whether southbound funds can hedge against foreign capital's discount rate pressure.
For crypto: Three channels, directions not consistent.
The discount rate channel is negative. Rising real interest rates generally pressure duration assets, and BTC is structurally increasingly approaching the pricing method of a "no-cash-flow long-duration asset." The first half of 2026 already demonstrated this: during the period when yields hovered around 4%, BTC still fell from $117,000 to $63,000, mainly due to capital outflows and deleveraging—its impact may exceed the discount rate channel itself. This suggests one thing: for crypto assets, the first sensitive variable may not be the interest rate level, but the direction of marginal capital.
The yield channel is positive, but less discussed. The higher US Treasury yields are, the thicker the reserve income for stablecoin issuers that hold short-term US Treasuries as their main reserve asset. Industry research has provided a magnitude reference: Circle's reserve income in the second quarter of this year was $668 million, accounting for about 95% of revenue, and its business model is similar to converting on-chain liabilities into on-chain US Treasury portfolios. Each step up in interest rates thickens the spread of such "on-chain money market funds." The cost is on the holder side: after the risk-free rate stands above 5.3%, the relative opportunity cost of holding volatile assets rises simultaneously. Issuer income thickening and holder opportunity cost rising occur at the same time—this is the double-sided impact of rising interest rates on crypto assets.
The liquidity channel is tightening. Rising repo costs, disruptions in the financing market, and global portfolio rebalancing triggered by rising bond yields are all marginally withdrawing risk appetite. The force hedging this channel comes from ETFs: a late-September report said Bitcoin ETFs saw $2.4 billion in net inflows in a single week, appearing in the week when the China-US reciprocal tax reduction framework was announced.

A counterintuitive scene appeared in the third quarter: yields rose 72bp, and BTC rose about 33%. On a weekly basis, BTC went from about $63,600 at the end of June to $84,700 in the week of September 28, with a single-week surge of 23.7% in the week of August 10. This directly conflicts with the intuition that "rising yields are bearish for crypto." ››

Comparing weekly gains and losses over the past year week by week: in the third quarter, rising yields and BTC gains almost always appeared simultaneously; but looking at the full year, the relationship between the two was sometimes positive and sometimes negative, hardly stable. That is, simultaneous gains were a phenomenon specific to the third quarter, not a reliable rule. If the two stably moved inversely, "rising yields are bearish for BTC" would be near common sense; if they stably rose together, BTC would have completely become a type of risk asset. Currently neither is the case—one possibility is that the dominant factor driving BTC in the third quarter switched, and interest rates retreated to a relatively secondary position.

On the daily chart, BTC did not fall after the September 16 rate hike, accelerated upward in late September, and closed at $84,469 on October 1. There are three explanations in the market for this synchronized rise. The first is inflationary: nominal interest rate increases are partially absorbed by inflation expectations—the Middle East situation once pushed WTI above $100, after which it fell back—nominal assets are usually more favored in an inflationary environment. The second is growth-oriented: AI capital expenditure boosts earnings expectations and risk appetite, yields and risk assets rise together, and the U.S. stock market showed exactly this combination during intraday trading on October 1. The third is liquidity-driven: continuous net inflows into ETFs combined with the implementation of the China-U.S. reciprocal tax reduction framework, with liquidity conditions temporarily overpowering the discount rate.
The three explanations are currently difficult to judge based on existing data alone, but their robustness differs: the first two are based on fundamental changes, while the third is based on capital flows, and the latter may reverse more quickly. One cross-signal worth tracking is: if yields continue to rise while ETF inflows slow markedly, it may mean that the situation described by the third explanation is receding—at which point the influence of the discount rate channel may re-expand.
IV. $113,000: The Preconditions for Citi's Target Price
On October 1, Citi raised its 12-month target price for Bitcoin from $82,000 to $113,000, and for Ethereum from $2,240 to $3,028, and expected net inflows of about $5 billion into crypto investment products over the next 12 months. On the day the report was published, spot BTC was quoted at $83,251 (Citi's basis), about 35.7% away from the new target. On the same day, the 10-year U.S. Treasury yield hit a new high since 2002—the research report and the market gave opposite tones.
The way to put the two into the same framework is to distinguish the time dimension. The $5 billion net inflow is a 12-month flow issue, while 5.34% is a price issue for the week; both can be true at the same time. This target implies three preconditions: ETF net inflows continue (currently materializing and accelerating, with a single-week inflow of $2.4 billion occurring just days before the report was published); the dollar and real interest rates remain controllable, with no discount rate shock (currently being tested—after the rate hike, traders are still pricing in more hikes, and the 30-year hit a 24-year high); regulation and risk sentiment remain stable (neutral).
For this target price, what is more worth watching is not the number itself, but its conditions for validity. Over the next few weeks, just watch two things: whether real interest rates hit new highs again; and whether weekly ETF inflows fall markedly from the billion-dollar level. If both conditions hold, this path remains valid; if either weakens markedly, the reference value of this target price may decline, and market pricing may return to range-bound trading.
V. Performance of Six Types of Bitcoin-Related Instruments Over the Past Year
The same judgment—bullish on Bitcoin—can be expressed through six types of instruments with completely different structures. This section compares the performance of the six types of instruments over the past year: how much do the results differ when the instruments differ. As for which type to choose, that depends on each person's position structure and drawdown tolerance; this is not a question this article can answer, nor should it answer. All figures come from public market data and financial reports, with prices as of the October 1 U.S. stock market close (pre-market on October 2 not included), and gains/losses based on weekly closing basis (week of 2025-09-28 to week of 2026-09-28).

Spot and spot ETFs: directly track the asset price. Over the past year, BTC fell 24.5%, while IBIT fell 22.6%, a difference of 1.9 percentage points, mainly due to fees and tracking error. On October 1, IBIT closed at $47.75, with a scale of about $80 billion. This type of instrument has no operating-level variables mixed in: if the macro judgment is correct, it benefits; if the judgment is wrong, it suffers, and it will not be rewritten by company decisions, nor does it have other businesses to provide a buffer.
Operating platforms: a combination of cash flow and trading volume. Robinhood (HOOD) closed at $111.15 on October 1, down 8.7% over the past year and down 3.5% year-to-date in 2026, the smallest decline among the operating platform group. The tolerance the market gives it is related to its revenue structure: fiscal year 2025 revenue was $4.47 billion (+52%), net profit was $1.88 billion, and crypto is only one of its business lines. Quarterly volatility remains significant—Q1 2026 revenue was $1.067 billion, falling to $535 million in Q2—this is normal for a trading business, not operational deterioration.
Coinbase (COIN) closed at $189.29 on October 1, down 39.4% over the past year and down 20.0% year-to-date in 2026, a version in the same group with higher dependence on crypto trading volume, and its decline is also deeper. Fiscal year 2025 revenue was $7.18 billion (+9.4%), with growth clearly slowing; in Q1 and Q2 2026 it recorded net losses of $394 million and $359 million respectively, while fiscal year 2025 still had a full-year profit of $1.26 billion. During the period when BTC fell from $117,000 to $85,000, trading volume and the fair value of holdings came under pressure simultaneously, and the income statement changed faster than the stock price. To what extent this decline is an overreaction needs to be verified by trading volume data in subsequent financial reports; it is hard to tell from the stock price alone.
In the first half of 2026, HOOD's revenue and net profit were both positive, COIN had the largest revenue scale but recorded a loss, and CRCL's combined net profit for the two quarters was about $104 million.

In the first half of 2026, HOOD's revenue and net profit were both positive, COIN had the largest revenue scale but recorded a loss, and CRCL's combined net profit for the two quarters was about $104 million.
Stablecoin issuers: indirect beneficiaries of rising interest rates. Circle (CRCL) closed at $82.91 on October 1, down 34.7% over the past year and down 0.7% year-to-date in 2026. Fiscal year 2025 revenue was $2.75 billion (+64%), with a full-year net loss of $70 million; in Q1 and Q2 2026 net profit turned positive ($55.25 million and $48.22 million), with a net margin of about 7%. The logic is straightforward: reserve income accounts for about 95% of revenue, and each step up in interest rates thickens the spread in this business. Yet the stock price is down 34.7% over the past year—the market is worried about two other things: valuation level and distribution costs, and the interest rate tailwind is not enough to fully cover them. Circle simultaneously bears two opposing forces: the higher the interest rate, the thicker the reserve income; the higher the interest rate, the higher the opportunity cost for holders to hold stablecoins. The relative strength of the two may be an important factor affecting the subsequent direction of the stablecoin business model.

Leveraged proxies and mining stocks: high-elasticity instruments. Strategy (MSTR) closed at $160.50 on October 1, down 48.1% over the past year and up 2.1% year-to-date in 2026. Its decline over the past year exceeded BTC itself, and volatility was also amplified during the rebound phase. This is precisely the characteristic of leveraged instruments: large fluctuations can occur in both directions.
Mining stocks provide another observation angle. MARA closed at $11.21 on October 1, down 30.5% over the past year and up 13.1% year-to-date in 2026; CLSK closed at $12.52, down 3.4% over the past year and up 8.4% year-to-date in 2026. Both outperformed BTC year-to-date in 2026, but their performance over the past year diverged markedly: CLSK's decline was far smaller than MARA's. Mining stock pricing simultaneously includes hash rate expansion, electricity costs, and post-halving unit economics, and its linkage with coin prices is not stable—viewing it as a "cheap substitute" for BTC was not supported by data over the past year.
The return gap among the six types of instruments has narrowed across the board: over the past year BTC fell 24.5%, and the other five all moved toward it—those with higher leverage characteristics fell more deeply (MSTR -48.1%), while those with more diversified revenue sources fell relatively less (HOOD -8.7%, CLSK -3.4%), and none broke out with an independent trend. The differences among instruments are essentially differences in risk characteristics: historically in similar environments, instruments with higher elasticity often rose more; while in phases dominated by discount rate pressure, their drawdowns were usually deeper. The differences themselves are not about superiority or inferiority, but holders need to be clear about which risk characteristic they are exposed to.
VI. Watchlist
In the coming weeks, the following signals are more important than the yield level.
VII. Final Thoughts
A surge in yields is easily read as one of two extreme narratives: either "bad news exhausted" or "bond market doomsday." This round of market action gives a third answer—the pricing weight is shifting from monetary policy to fiscal reality. This process has no ending bell, only batches of cash flows being repriced.
History has given us similar moments. The last time the 10-year yield stood near the 5% integer mark, the market also went through a debate of "supply narrative vs. demand collapse," which ultimately ended with a phased pullback in yields; behind the 5.3% high in 2007 was a completely different credit cycle. The same level, a different structure—the conclusions cannot be copied wholesale. The particularity of this round lies in the scale of the fiscal bill and its global synchronicity, which means the room for a pullback may be narrower than historical experience suggests.
For crypto investors, concrete signals are more useful than macro stances. The tug-of-war between capital flows and discount rates is still ongoing. The simultaneous rise in Q3 shows that capital flows temporarily have the upper hand, and also shows that the fragility of this tug-of-war is accumulating. Going forward, key indicators to watch include the 10-year yield, financing costs, 30-year auction results, and repo spreads, in order to judge how the relative influence between capital flows and discount rates is changing.
Now pull the lens back one more layer. A world where the risk-free rate stands above 5% has implications for the crypto industry that go beyond price. On-chain native activity needs to compete with this new yield benchmark: staking yields, stablecoin spreads, and RWA product pricing all have to answer the same question—after deducting the risk-free return, how much compensation is left. The valuation habits cultivated in the zero-rate environment of 2021 are being re-audited item by item. At the issuer level, thicker reserve income is a tailwind; at the application level, user retention must clear an additional 5.3% threshold. The question the industry has debated for the past two years—"what exactly are the fundamentals"—will be forced to give a more concrete answer in this rate environment.
As for who ultimately picks up this bill, the October auction schedule and repo spreads will give the answer before any commentary does. For now, only one thing is certain: the handover of pricing power has not yet been completed.
Data Sources
Disclaimer: The content of this article is for general informational and market commentary purposes only, and is based on public materials available as of the time described in the text. Relevant market data, expectations, and probabilities may change with market conditions. The views and investment strategies of third-party institutions, analysts, or other persons cited in this article represent only the views of the relevant third parties at a specific time and do not represent the views or recommendations of BIT. This article does not constitute investment advice, investment research, an offer, solicitation, or recommendation of any securities, investment products, or trading strategies, nor should it serve as the basis for any investment decision. Financial markets involve risk; securities prices and market performance may fluctuate, and historical performance and past market trends do not represent or guarantee future results. Investors should independently assess the relevant risks based on their own circumstances and seek professional advice when necessary.