


Bitcoin has fallen below $81,000 on October 15, losing more than 3% in 24 hours as hotter U.S. inflation data, falling Asian stocks, and approximately $483 million in Bitcoin and Ethereum futures liquidations weighed on cryptocurrency markets.
Summary
- Bitcoin fell below $81,000 on October 15 as U.S. inflation concerns triggered another market selloff.
- CoinGlass data showed roughly $483 million in Bitcoin and Ethereum futures liquidations over 24 hours.
- Ethereum accounted for $286 million in liquidations, exceeding Bitcoin’s reported $197 million during the period.
- U.S. September inflation reached 3.7%, while South Korea’s Kospi fell 8% during Thursday morning trading.
- Analyst Crypto Patel identified $80,108 as critical support, warning of potential declines toward $65,000 afterward.
CoinGecko reported Bitcoin trading near $80,664 during Thursday’s Asian session, down 3.21% over the previous 24 hours and 2.53% over seven days. The cryptocurrency recorded approximately $40.43 billion in daily trading volume and a market capitalization of $1.62 trillion.
Meanwhile, derivatives data showed that Ethereum traders faced heavier forced liquidations than Bitcoin traders during the same period.
Bitcoin price drops as U.S. inflation reaches 3.7%
Bitcoin’s decline followed the release of stronger-than-expected U.S. inflation figures on Wednesday, which renewed concerns about the Federal Reserve’s interest rate plans.
The U.S. Bureau of Labor Statistics reported that consumer prices increased 3.7% over the 12 months ending in September. The reading exceeded August’s 3.4% annual inflation rate, while monthly inflation climbed 0.6%.
Core inflation, which excludes food and energy, increased 0.3% during September and reached 2.6% annually. Economists had expected a smaller increase in the monthly core reading.
Gasoline prices increased 9.1% during the month, accounting for more than half of the overall monthly rise in consumer prices. The government recorded a 5.2% monthly increase in its energy index.
The figures prompted renewed speculation that the Federal Reserve could raise interest rates to control rising prices. Higher borrowing costs can influence investment decisions across stocks, bonds, and cryptocurrencies, although inflation data alone does not establish the cause of Bitcoin’s price movements.
As previously covered in Bitcoin’s price reaction to the U.S. inflation report, BTC had already fallen below $82,000 on October 14 after failing to sustain its earlier recovery toward $84,000.
The latest decline extended that weakness into Thursday’s Asian session, bringing the $80,000 price level back into focus.
Nearly $483M in Bitcoin and Ethereum futures liquidated
The cryptocurrency selloff forced the closure of leveraged trading positions as prices moved against traders who had borrowed funds to increase their exposure.
According to CoinGlass liquidation data, Bitcoin and Ethereum futures accounted for approximately $483 million in forced position closures over 24 hours.
Ethereum traders recorded roughly $286 million in liquidations, while Bitcoin contracts accounted for approximately $197 million.
The figures represented the notional value of positions closed by exchanges, not the exact amount of money individual traders lost.
A liquidation occurs when a leveraged position no longer has sufficient collateral to cover its exposure. An exchange may automatically close the trade to prevent the account’s remaining funds from falling below the required margin.
As market prices fall, forced closures of long positions can generate further selling activity.
Ethereum recorded the largest liquidation total among the two cryptocurrencies despite having a smaller futures market.
Outstanding Ethereum futures contracts stood near $30 billion, compared with approximately $52 billion for Bitcoin.
Ether fell roughly 6.4% toward $2,356 during the period, while Bitcoin declined around 3.2% toward $81,000.
The selling extended across other major cryptocurrencies. Solana dropped approximately 5.5%, with its futures market recording roughly $31 million in liquidations. Zcash declined around 13%, accompanied by nearly $19 million in forced contract closures.
XRP and Dogecoin faced pressure as well, with reported declines of approximately 5% and 6%, respectively.
Earlier reporting on Bitcoin’s liquidation risks ahead of inflation data had identified the possibility of another round of forced selling if consumer prices exceeded expectations.
Asian stock markets tumble alongside Bitcoin
Thursday’s losses extended beyond cryptocurrencies as major Asian stock markets fell sharply following the previous session’s decline on Wall Street.
South Korea’s Kospi dropped approximately 8% during morning trading, according to market reports. Shares of Samsung Electronics and SK Hynix, two major semiconductor manufacturers, fell more than 9%.
Japan’s Nikkei 225 declined around 5%, with technology companies among the hardest-hit stocks.
The losses followed Wednesday’s U.S. market decline, when the Nasdaq Composite closed 1.88% lower and the S&P 500 fell 1.11%. The Dow Jones Industrial Average slipped 0.09%.
Technology shares came under pressure as investors considered whether the Federal Reserve might need to keep monetary policy restrictive for longer.
The U.S. inflation report prompted traders to reassess the likelihood of further interest rate increases. Market expectations remained sensitive to incoming economic figures and comments from central bank officials.
Bitcoin had already struggled to maintain a recovery above $84,000 before the inflation report.
In earlier coverage of Bitcoin’s failed move toward $84,000, market data showed that selling pressure had limited gains despite several attempts to recover.
Thursday’s decline brought BTC back toward prices last seen during the previous week’s periods of heavy trading activity.
Can Bitcoin recover from $80K or fall toward $65K?
Crypto analyst Crypto Patel warned that Bitcoin was testing an important technical level near $80,108 after falling from approximately $87,360 to $80,200.
Patel described the move as a 7.5% decline from the earlier price level and identified $80,108 as a level that traders should monitor.
“A clean breakdown below $80,108 followed by a confirmed HTF candle close could open the door to the 70K–65K downside zone,” the analyst wrote.
The projection remains conditional. Bitcoin has not confirmed a move toward $65,000 merely by trading near the identified support level.
Another market commentator, Crypto Lens, claimed that the wider cryptocurrency market had lost more than $140 billion in value during the downturn.
The analyst warned of a possible sequence of lower Bitcoin prices, naming $75,000, $70,000, and $57,000 as potential downside targets.
Those projections represent the commentator’s opinion and are not confirmed price outcomes. The separate claim of nearly $1 billion in long liquidations uses a different figure from the approximately $483 million in Bitcoin and Ethereum futures closures reported in the earlier CoinGlass snapshot.
On Bitcoin’s daily technical chart, BTC traded near $80,718, with momentum indicators continuing to weaken.
The Moving Average Convergence Divergence indicator, or MACD, remained below its signal line. Its histogram stood near -629, pointing to negative short-term momentum in the supplied chart reading.
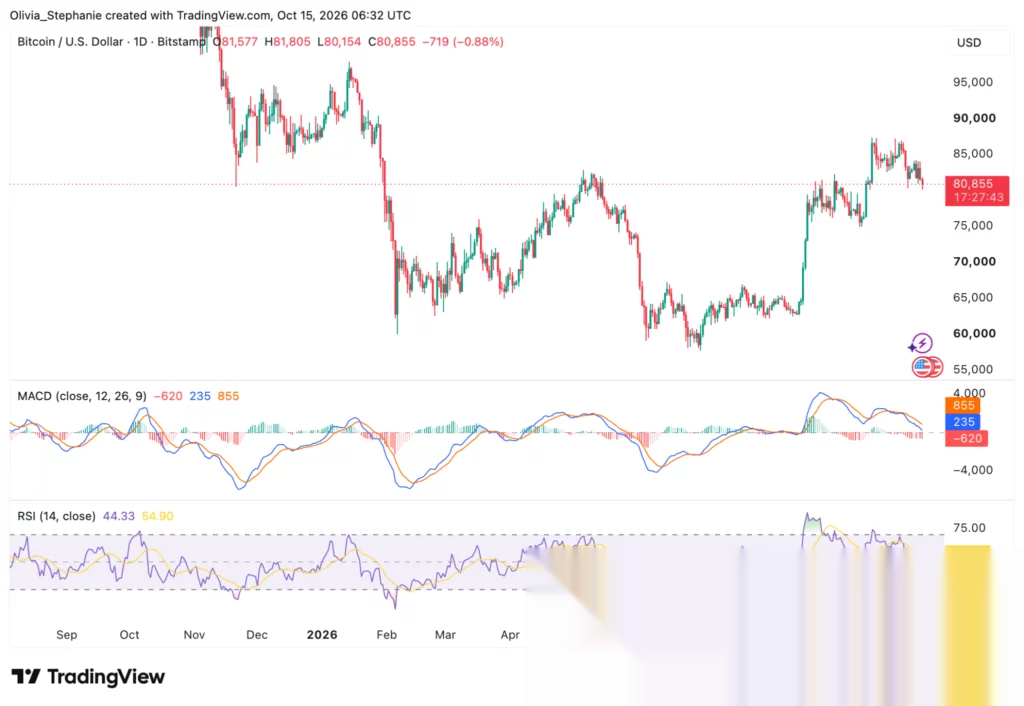
The Relative Strength Index (RSI) measured 43.92, below the neutral 50 level and its moving average of 54.87. However, the RSI remained above 30, the level commonly used to identify oversold conditions.
Technical levels place immediate attention on the $80,000 area. A sustained move below that price could expose Bitcoin to lower support levels, while a recovery above 83,000–85,000 would indicate improving short-term momentum.
An earlier Bitcoin analysis ahead of the inflation release presented a similar two-way scenario. Analysts identified $80,000 as a downside level and $86,000 as a possible recovery target if market conditions improved.
Bitcoin’s October 15 daily chart remained below the 83,000–85,000 recovery zone, with its RSI at 43.92 and a negative MACD histogram near -629.