

Bitcoin price has slipped toward $84,000 after failing to hold its latest push above $87,000, while daily momentum has weakened and liquidation clusters have formed on both sides of the market.
Summary
- Bitcoin price traded near $84,575, down 1.7% over 24 hours.
- The daily chart places Bitcoin near the $84,012 Fibonacci level after its latest rejection.
- CoinGlass shows prominent liquidation clusters around $83,500, $85,100, and $87,700.
- Analyst Altcoin Sherpa expects buying near support but warns that losing $82,000 would weaken the setup.
CoinGecko recorded Bitcoin at approximately $84,575 on Oct. 3, with a 24-hour decline of 1.7% and a seven-day gain of 0.8%. Daily trading volume stood near $37.3 billion, while the asset’s market value was about $1.7 trillion.
TradingView’s Binance BTC/USDT daily chart shows the latest advance reaching $87,220 before falling back toward $84,000. The retreat left Bitcoin close to a major Fibonacci level, with the recent September highs still forming overhead resistance.
Bitcoin holds near the $84,012 Fibonacci level
The daily Fibonacci retracement on TradingView spans the move between $126,294 and $57,877. Its 61.8% level sits at $84,012, almost directly alongside the price shown on the daily chart.
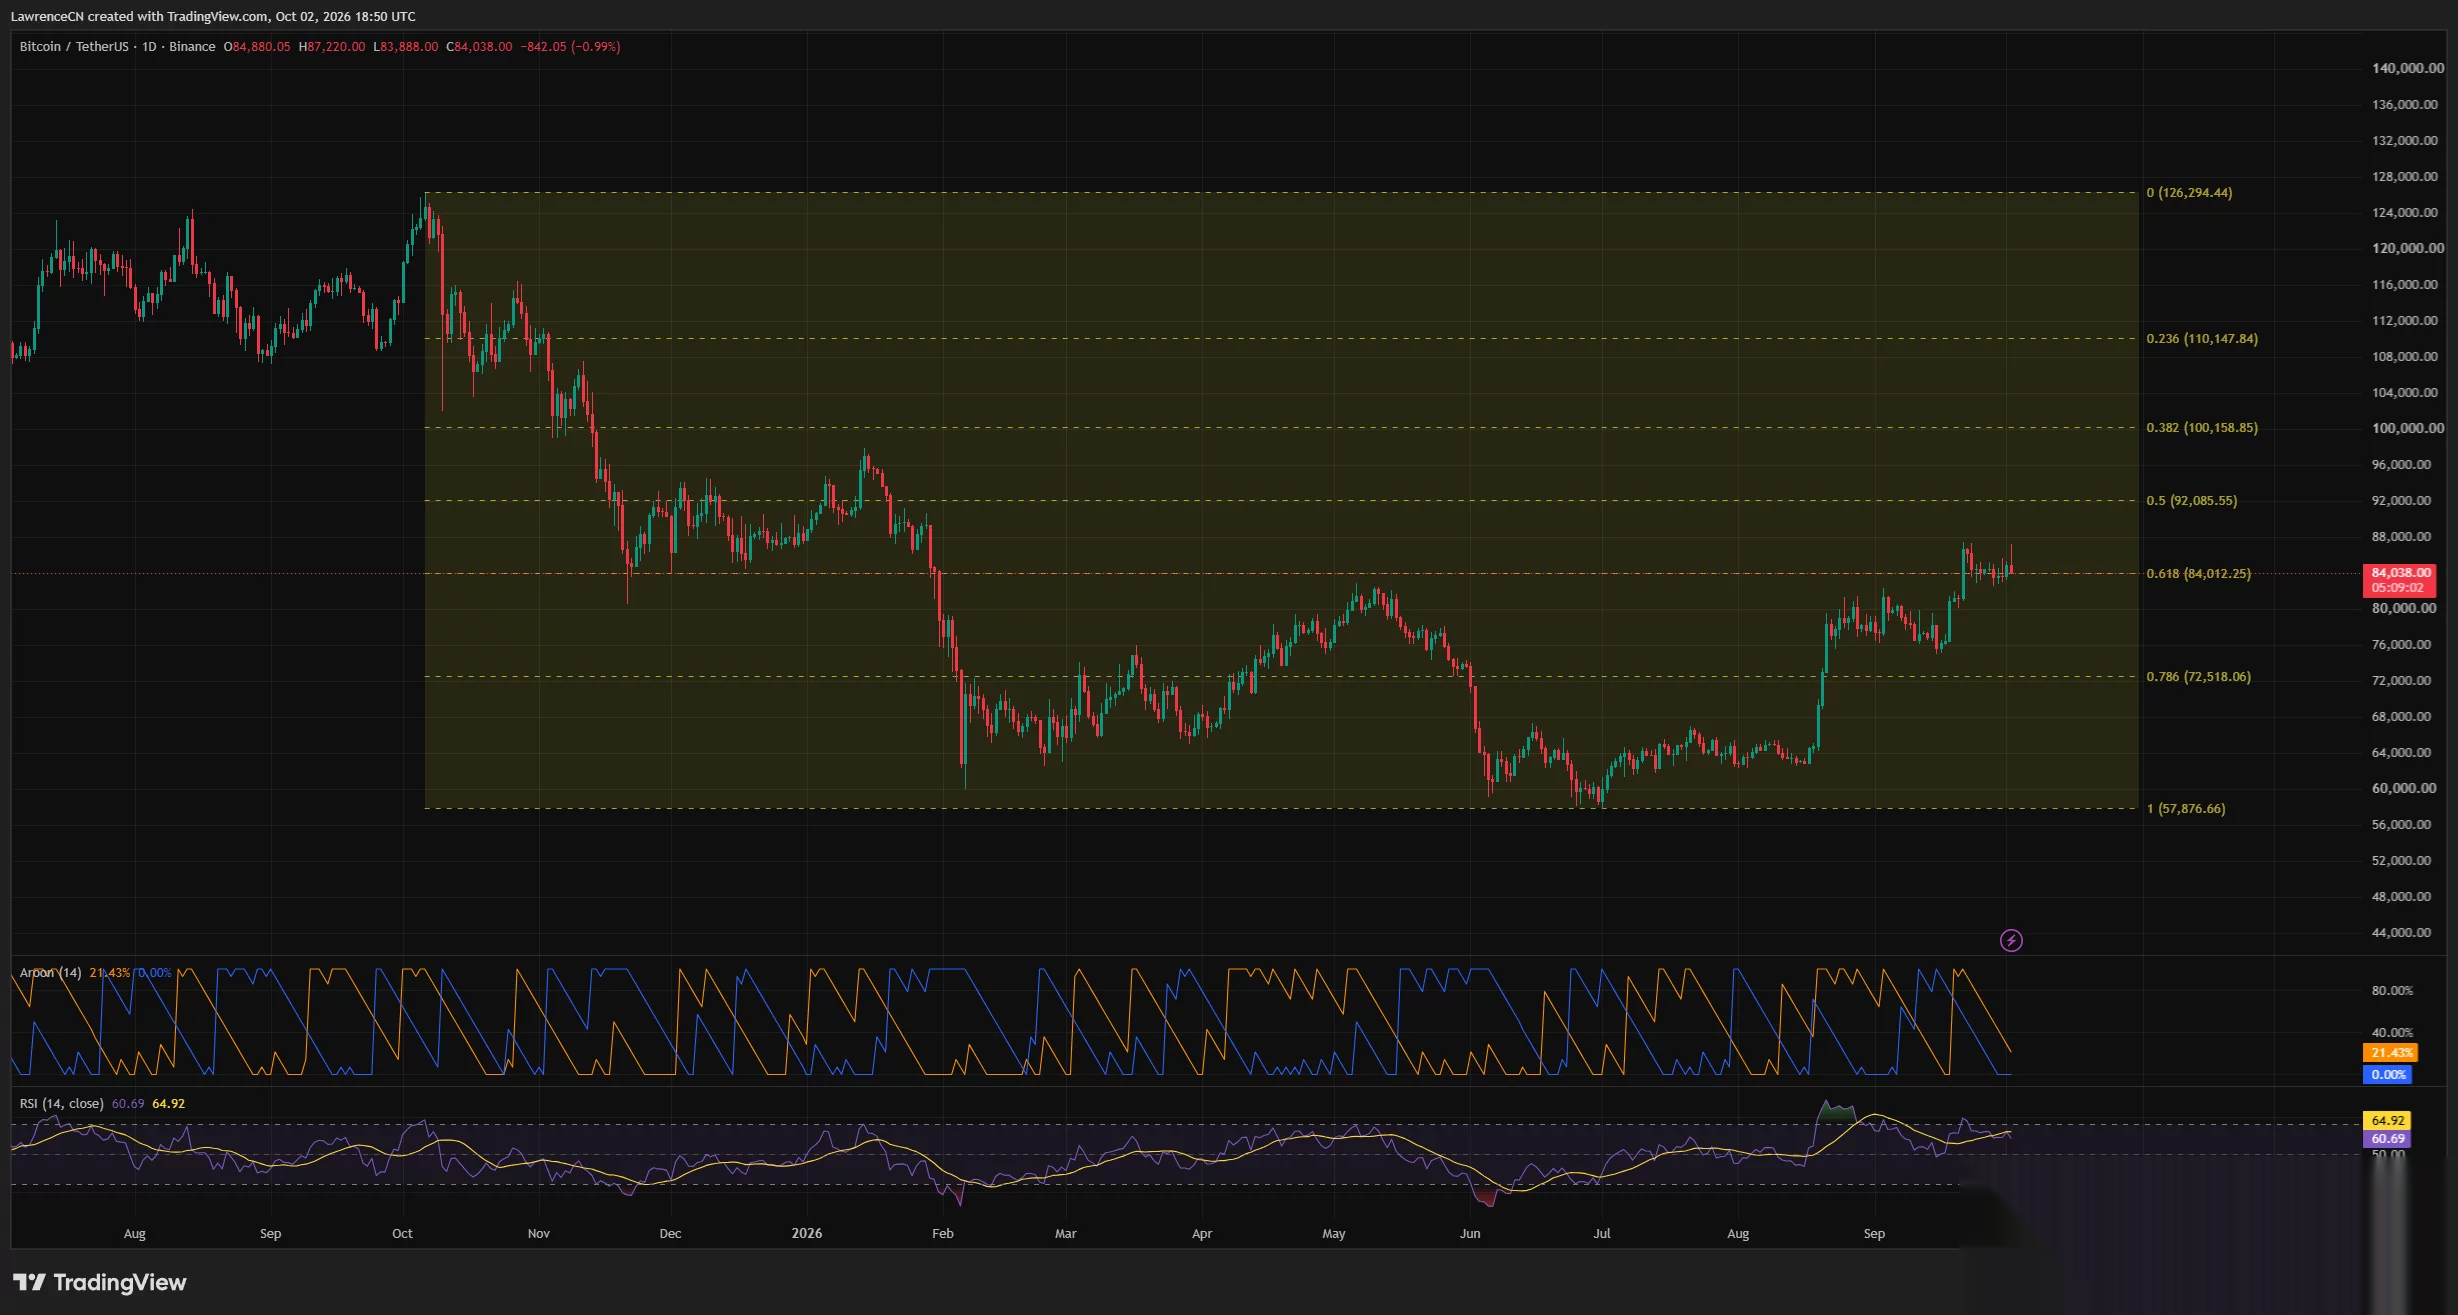
Bitcoin’s September recovery carried it from roughly $75,000 into the $86,000–$87,000 area. Several recent attempts to extend that move have stalled around similar highs, leaving the asset above its earlier September range but below the latest resistance zone.
The daily relative strength index stood at 60.69, below its moving average of 64.92. An RSI above 50 keeps momentum on the positive side of the scale, although the gap beneath its average shows that the latest upward push has lost strength.
The Aroon readings also reflected the pause. Aroon Up was 21.43%, while Aroon Down was 0%, placing both readings well below their upper range as Bitcoin traded between its recent high and the earlier lows.
On the daily chart, $84,012 is the nearest marked Fibonacci reference. Below that area, recent price action places another support zone around $82,000–$83,000, followed by the round $80,000 level and the September base near $75,000–$76,000.
A recovery above the recent $87,220 high would bring the $88,000–$90,000 area into focus. The next higher marked Fibonacci level is $92,086, the halfway point of the larger range, rather than an immediate price target.
The 4-hour chart puts $86,092 back in focus
TradingView’s 4-hour chart shows Bitcoin retreating from its latest rise toward $87,000 and returning to the middle of its Bollinger Bands. The 20-period moving average stood at $84,227, with the upper band at $86,092 and the lower band at $82,362.
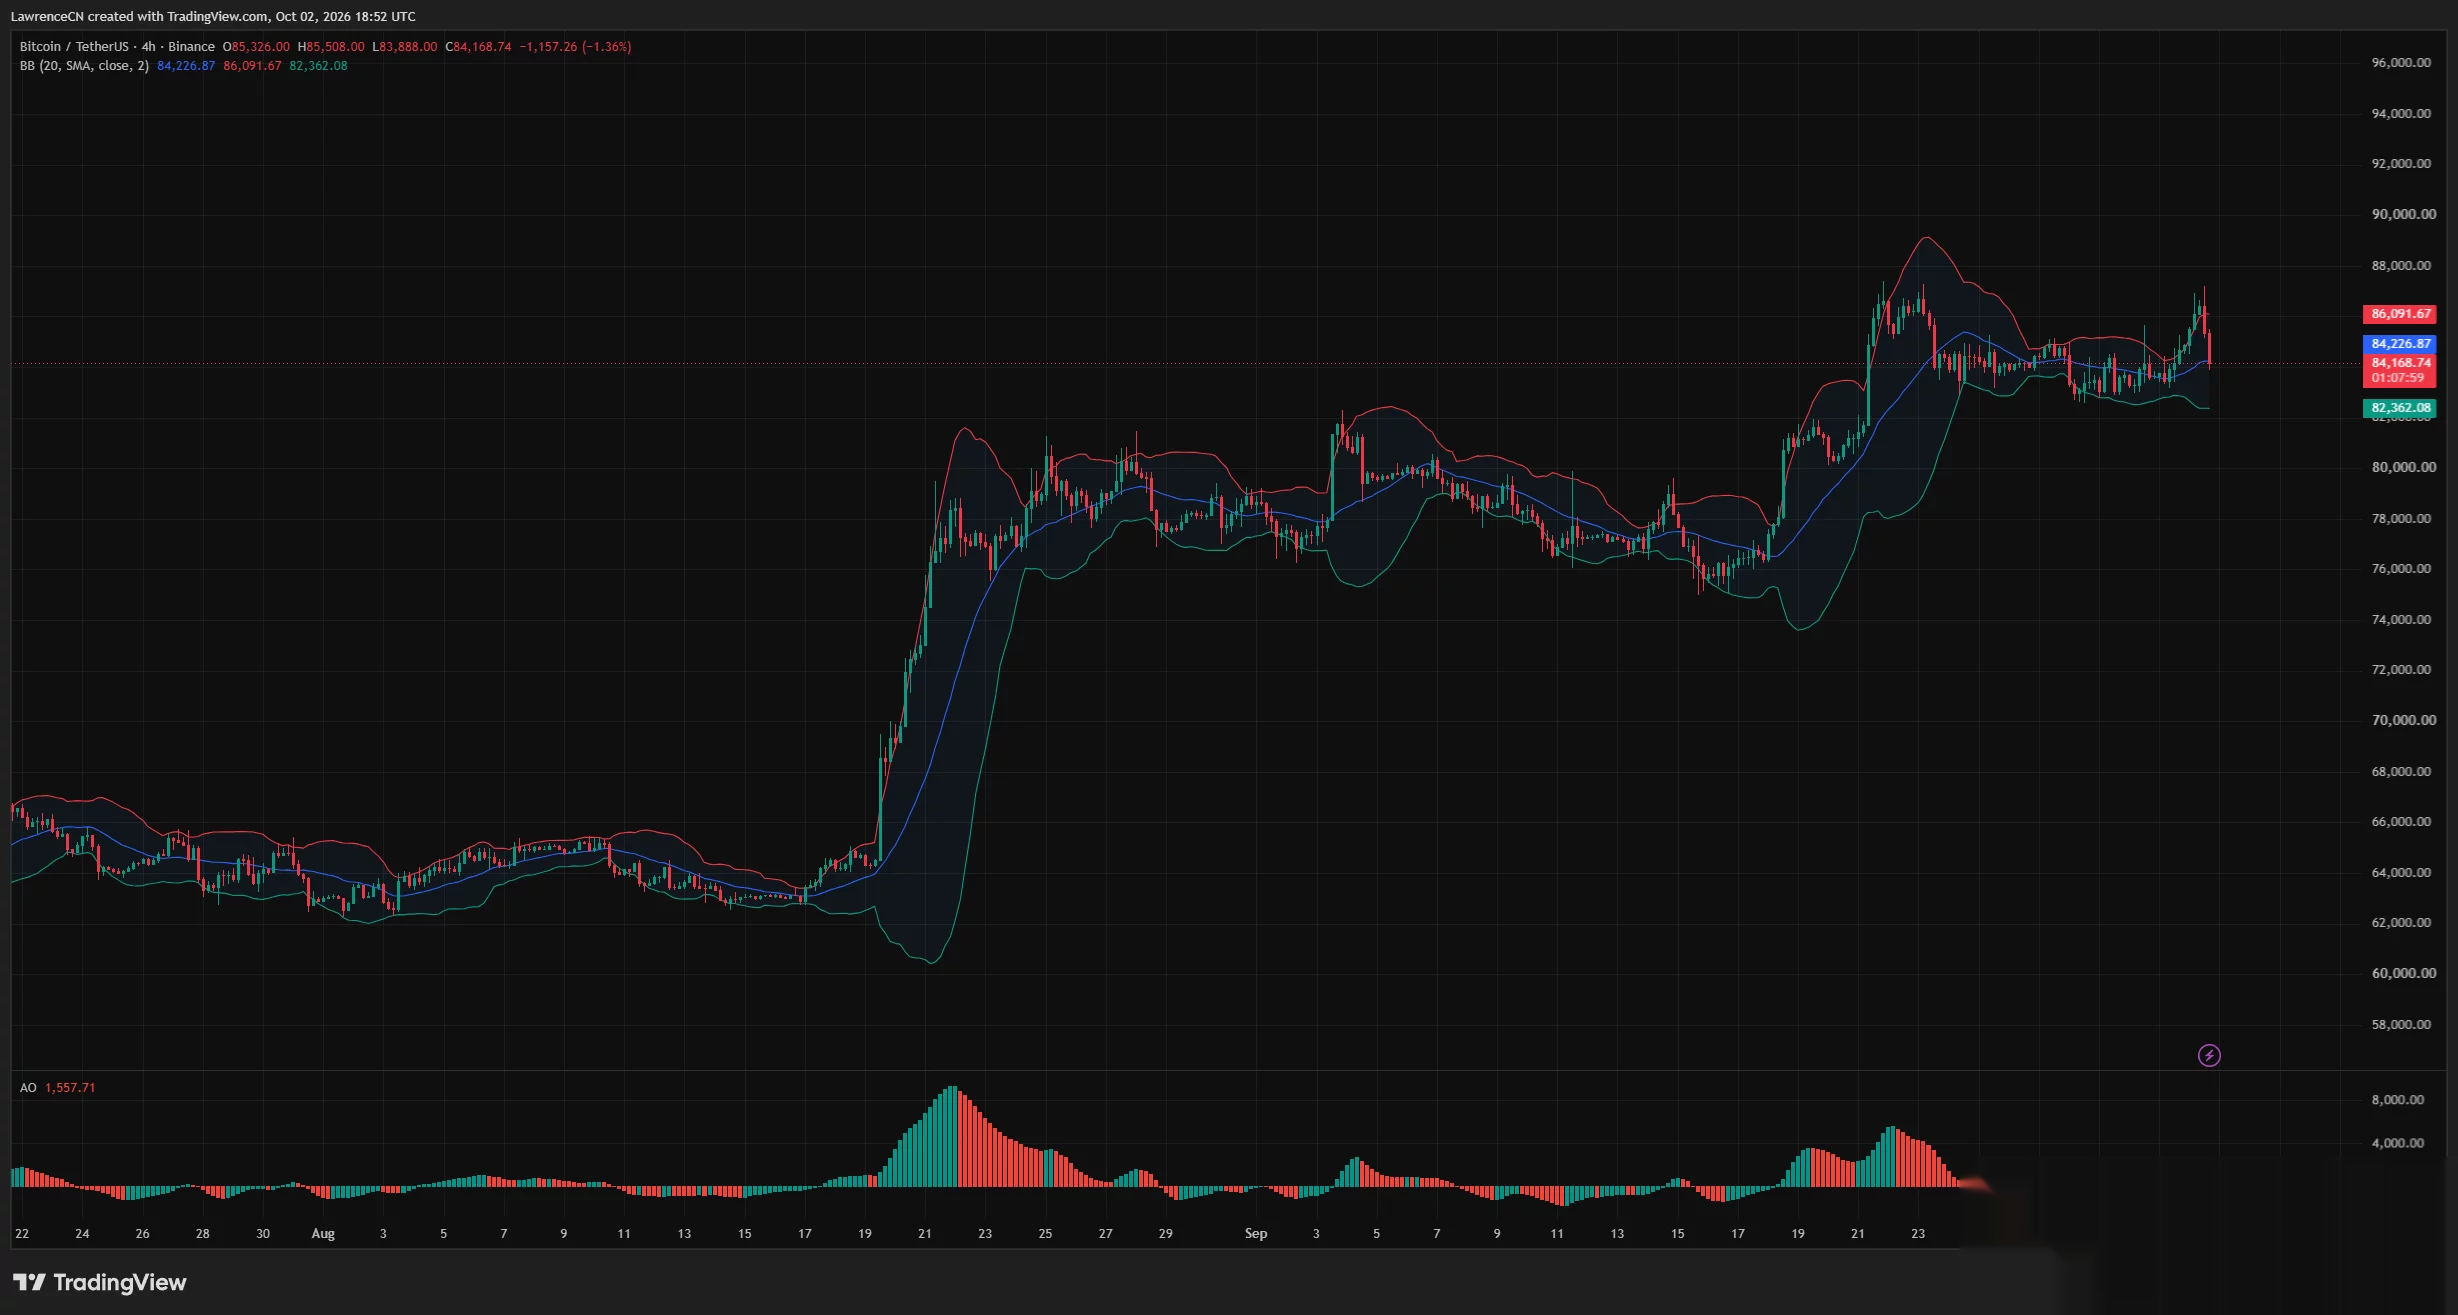
Price was slightly below the middle band after the pullback. The upper band now provides a nearby technical reference before the recent high, while the lower band overlaps the broader $82,000–$83,000 support region.
The Awesome Oscillator remained above zero at 1,557.71. Its latest histogram bar was red after a run of rising green bars, showing a decrease in positive momentum on the 4-hour timeframe.
The earlier advance from mid-September remains visible on that chart, with Bitcoin rising from around $75,000 to above $86,000. Since that rally, trading has largely stayed between the low-$82,000 region and the recent highs near $87,000.
For the near-term recovery scenario, the middle Bollinger Band around $84,227 is the first reference, followed by $86,092 and $87,220. For the downside scenario, the lower band around $82,362 sits close to the $82,000 threshold identified by Altcoin Sherpa.
Liquidation clusters bracket Bitcoin’s trading range
CoinGlass’s 24-hour liquidation heatmap shows Bitcoin falling from above $86,000 to briefly below $84,000 before stabilizing in the mid-$84,000 area. A bright liquidation band sits around $83,500 beneath the latest price.
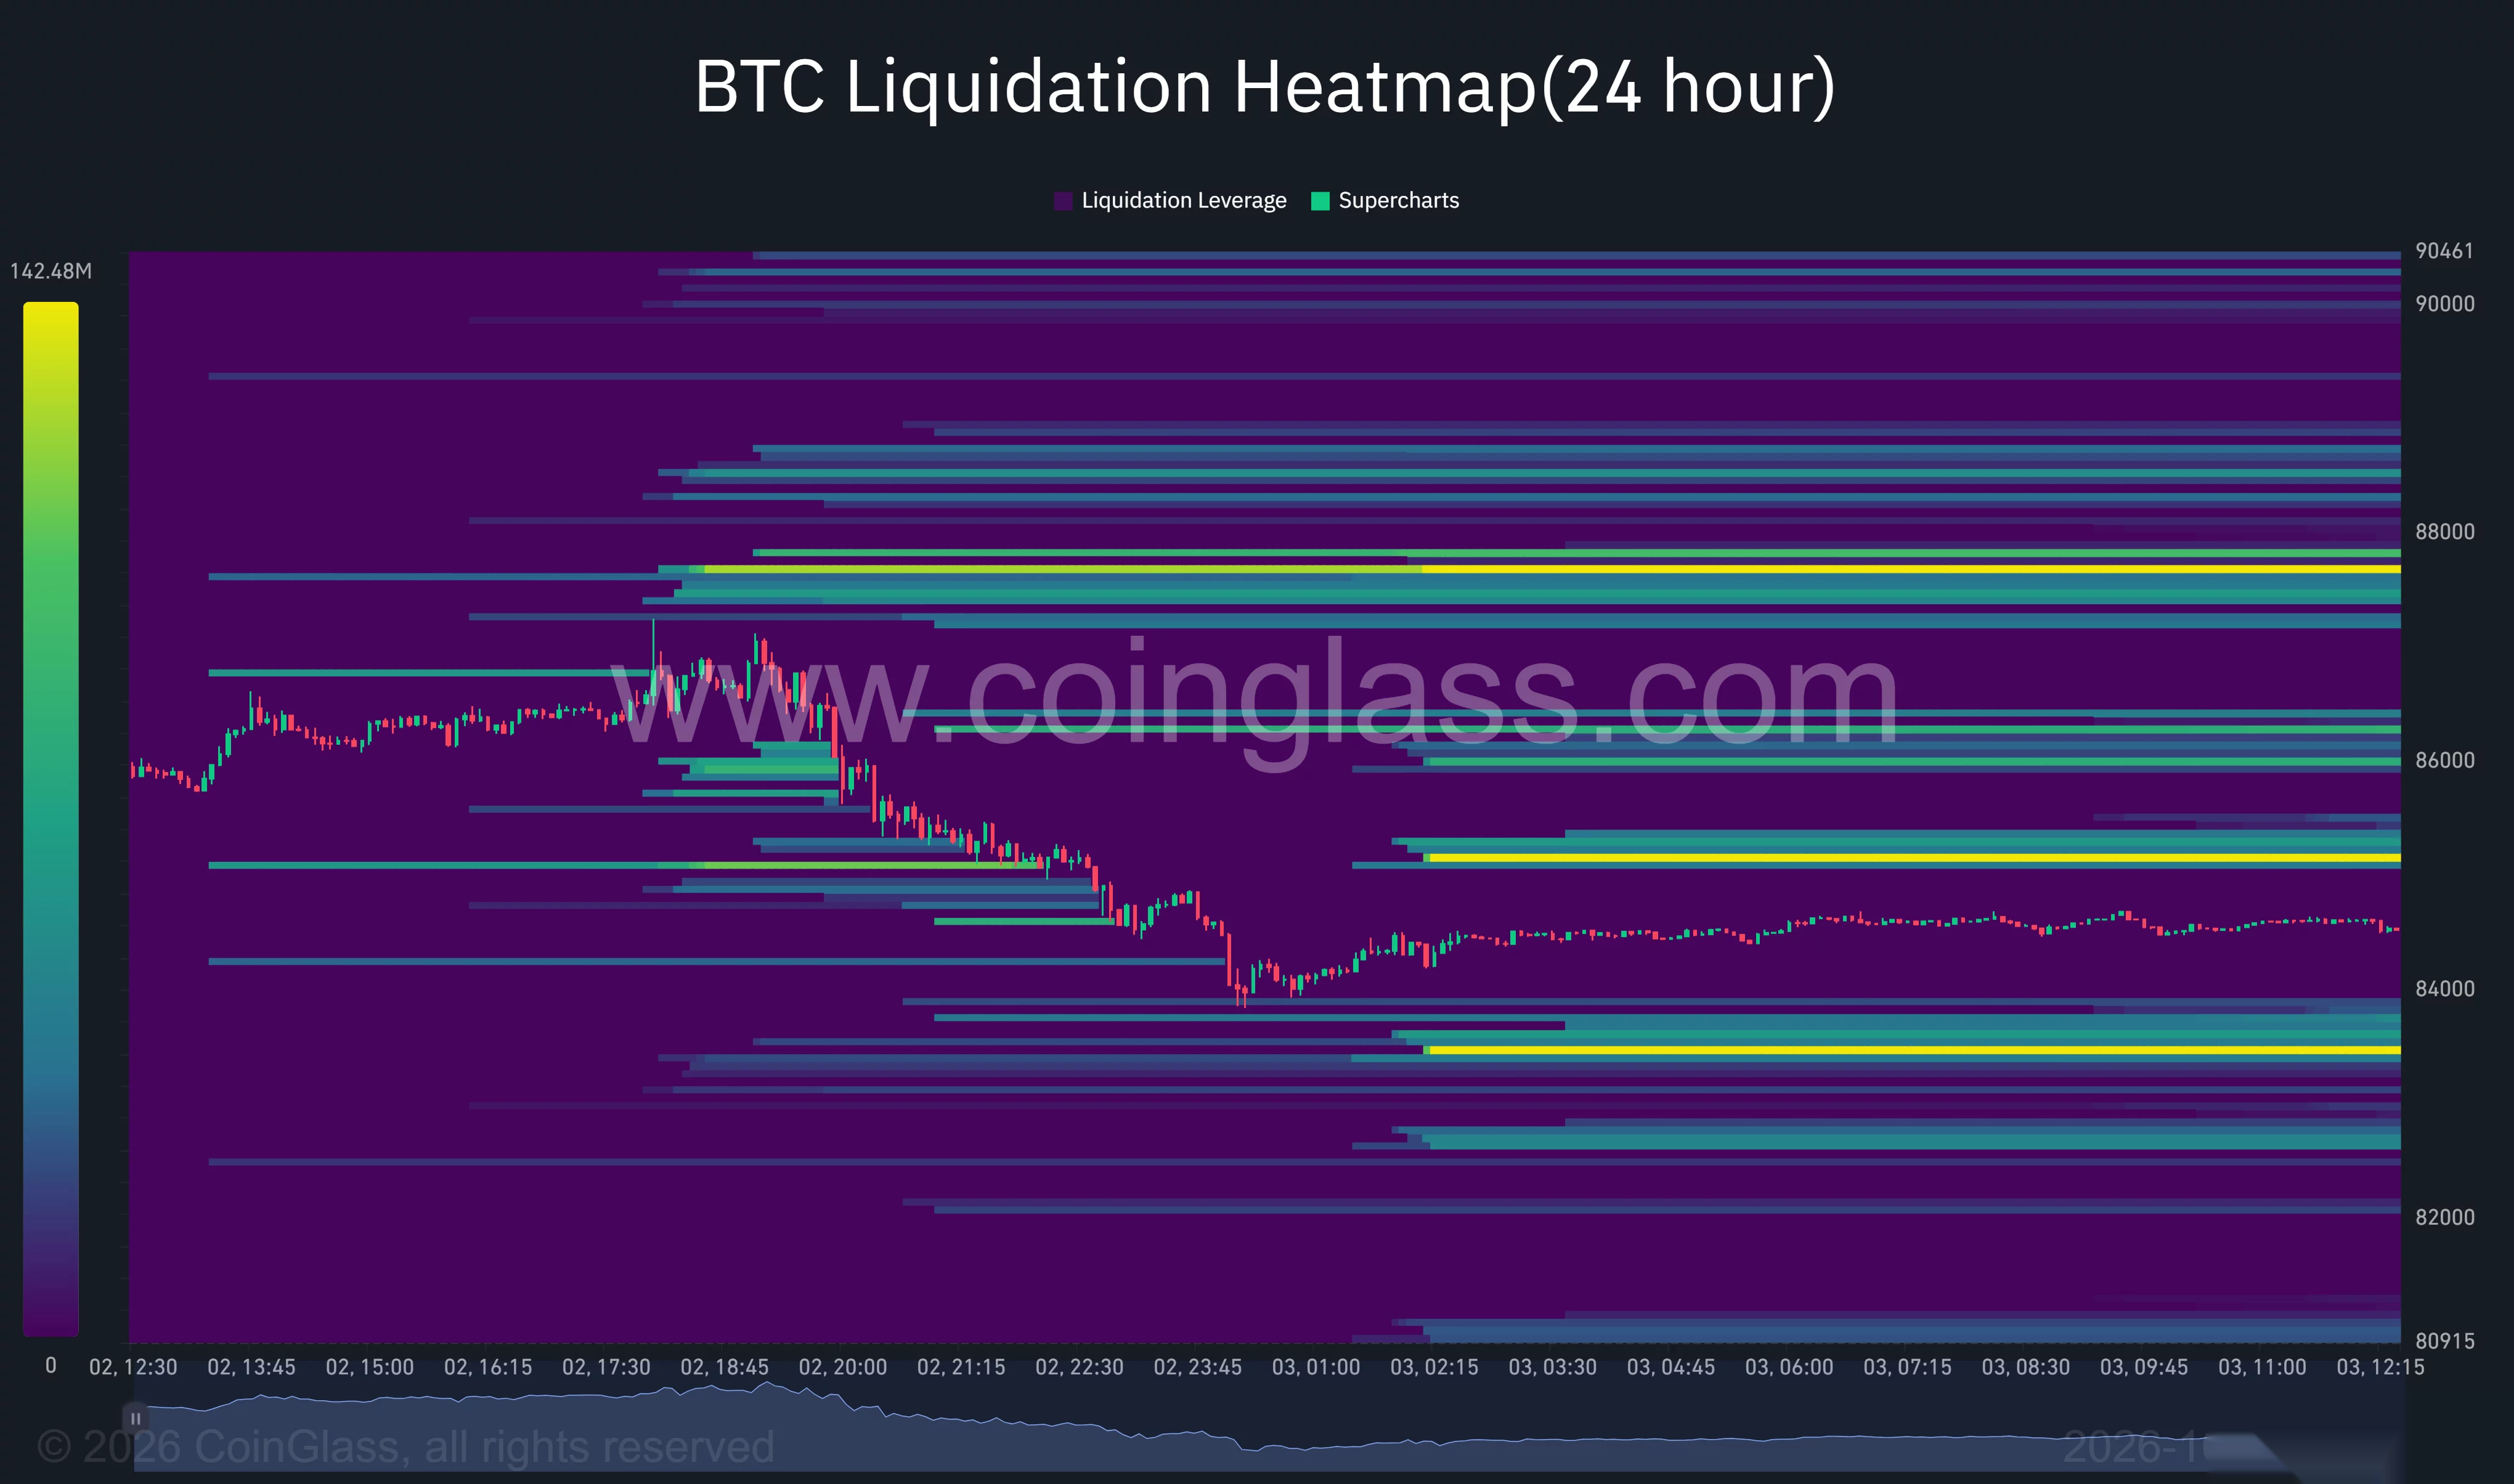
Above the market, another prominent band lies around $85,100, with additional concentrations near $86,000–$86,400. The strongest upper cluster is around $87,700, slightly above the recent price highs.
The map also shows lower bands near $82,600–$82,800 and $82,000. Those areas overlap the support region visible on the 4-hour chart, placing several derivatives reference points below Bitcoin’s current range.
Pseudonymous analyst Wealthmanager described a separate order-book setup with heavy bids at $80,000–$82,000 and asks above $84,000 through $90,000. The analyst said a move toward $90,000 would depend on those lower bids holding and Bitcoin working through the sell orders above it.
Altcoin Sherpa also favored a potential bounce near current support, citing the volume profile. The analyst wrote:
“If we lose 82k or something then I think it starts to get really nasty”
The analyst nevertheless expected buying to return near support, keeping the outlook conditional on Bitcoin defending the lower part of its range.
US ETF buying has slowed from September’s peak
Farside Investors’ data show that US spot Bitcoin ETF inflows slowed sharply after reaching $999 million on Sep. 21. Net inflows fell to $134.5 million on Sep. 25, although the five sessions together still brought in approximately $2.39 billion.
The following week began with $31 million of inflows on Sep. 28 and $66.2 million on Sep. 29. Funds then recorded $148.7 million of net outflows on Sep. 30, including withdrawals from Fidelity’s FBTC, Bitwise’s BITB and BlackRock’s IBIT.
Those three sessions produced a combined $51.5 million net outflow. The figures mark a slower pace of buying through US investment products alongside Bitcoin’s struggle to extend above its September highs.
Bitcoin’s immediate chart references remain $84,012 on the daily timeframe and $82,362 on the 4-hour timeframe. Above the market, the $86,092 Bollinger Band and the recent $87,220 high stand between the current price and Wealthmanager’s conditional $90,000 scenario.