

Summary
• The application focus of AI trading systems is shifting from short-horizon price prediction to market regime identification, cross-asset ranking, risk budgeting, event extraction, and execution cost control; model value will increasingly be measured by after-cost returns and risk stability.
• Crypto assets and equity markets share drivers such as liquidity, risk appetite, and growth style; BTC, ETH, SOL, technology indices, and AI leaders need to be incorporated into a unified risk framework to avoid asset-class diversification masking factor concentration.
• The GCRA strategy (Gate Cross-Asset Regime Allocation) forms daily positions through multi-horizon trend, crowding, volatility, and correlation signals, and sets leverage, drawdown, margin, and model-failure constraints, providing a clear path for paper trading and small-scale live validation.
• Gate spot, perpetual contracts, direct equity access, TradFi CFD, and TradFi Perps constitute a cross-asset execution system; product selection depends on holding period, trading direction, liquidity, funding rates, overnight costs, and account rules.
Introduction
The research value of AI trading systems centers on market regime identification, cross-asset ranking, risk budgeting, textual event extraction, and execution cost control. Delegating the direction of the next candlestick to a single model makes it vulnerable to noise, overfitting, and changes in market regimes. This report builds a cross-asset strategy that can be run daily for live validation, incorporating BTC, ETH, SOL, SPY, QQQ, and AI industry chain stocks into a unified framework, and completes product routing based on the trading hours, funding costs, account structures, and short-selling capabilities of different Gate products.
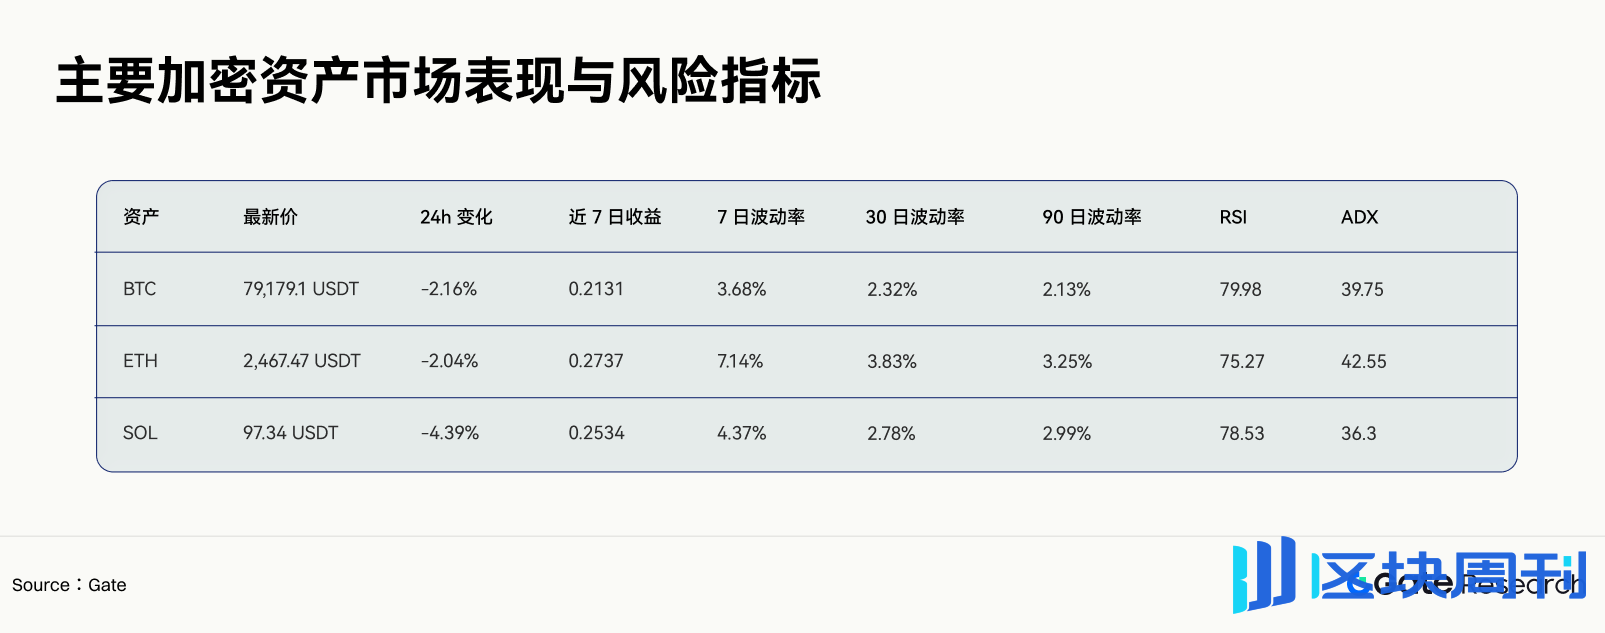
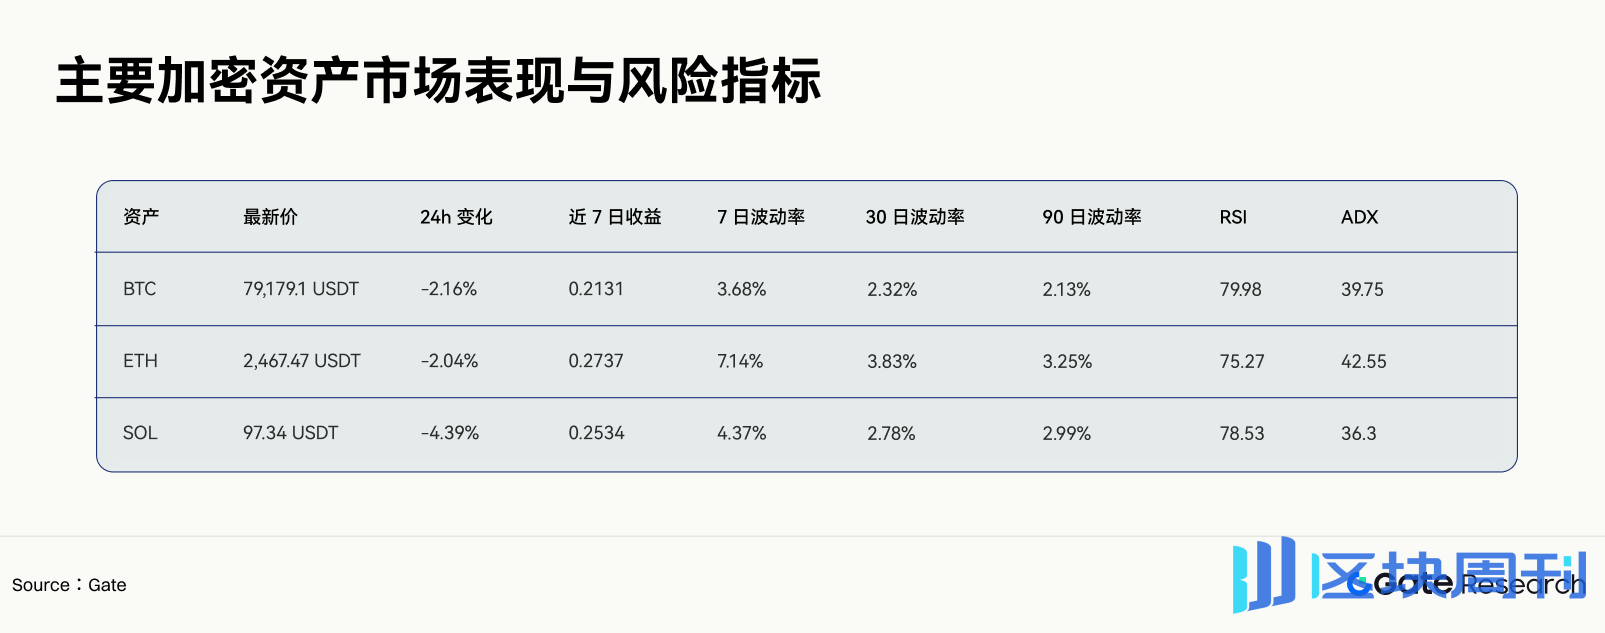
The crypto section uses 7-day returns, 7/30/90-day volatility, daily RSI, ADX, funding rates, long/short ratios, and 24-hour open interest changes; the equity section observes the past one-month path, index relative strength, individual stock returns relative to the index, and event windows. Gate data shows that BTC, ETH, and SOL rose approximately 21.3%, 27.4%, and 25.3% respectively over the past 7 days, with daily RSI for all three assets above 75, and open interest declining 1.84%–3.31% over the most recent 24 hours. The market is in a mixed state of medium-term trend continuation, rising short-term crowding, and marginal contraction of leverage.
This article proposes a live framework combining multi-horizon regimes, dual trend and crowding scores, volatility targeting, cross-asset correlation constraints, and Gate product execution. The system forms target positions once per day; intraday, the model is only responsible for execution and circuit breaking, and does not frequently flip direction based on short-term noise.
This article is for research and educational purposes only and does not constitute investment advice, a trading solicitation, a return promise, or automated order instructions. Stocks, crypto assets, CFDs, and perpetual contracts may all result in loss of principal. Leverage, gaps, funding rates, and declining liquidity can amplify losses.
I. Data Framework: From Snapshots to Multi-Horizon Evidence
1.1 Horizon Layering of the Crypto Market
Data as of: August 26, 2026 (all data in this article is as of this date)
The 7-day returns of all three assets are significantly positive, and the single-day pullback has not broken the weekly trend. ETH's 7-day volatility reached 7.14%, close to 1.86 times its 30-day volatility, indicating that short-horizon volatility expansion is concentrated in ETH. BTC's 7/30/90-day volatility is 3.68%, 2.32%, and 2.13% respectively; short-term risk has also risen, but by less than ETH.
The multi-horizon judgment follows this order:
• 90-day indicators define the baseline risk environment;
• 30-day indicators determine trend and volatility budget;
• 7-day indicators identify acceleration, crowding, and volatility expansion;
• 24-hour data is used only to confirm position changes and execution conditions.
1.2 Crypto Market Breadth and Funding Structure

The Fear and Greed Index is at a high level, while AHR999 remains in a lower range; the two indicators cover different horizons. The strategy retains allocation exposure over the long horizon and reduces new leverage over the short horizon. BTC dominance is close to 60%, and the altcoin season index is only 37; market gains remain skewed toward highly liquid assets, and broad altcoin diffusion has not yet been confirmed.
1.3 Derivative Positioning: Handling Trend Strength and Crowding Separately

Price declines and falling open interest occur in parallel, and leveraged funds are in a withdrawal phase. BTC's taker buy/sell ratio remains slightly above 1, while ETH and SOL are already below 1. SOL's long/short ratio reached 1.82, higher crowding than BTC and ETH. The system reduces long position size at this stage but does not directly establish contrarian positions based on high RSI.
1.4 Equity Market Uses Monthly Path and Relative Strength
SPY cumulatively changed about +3.66% between July 27 and August 25, 2026, with range highs and lows of approximately 778.98 and 731.00. QQQ experienced a -6.60% monthly drawdown in July, rebounding from 687.99 on July 31 to 723.70 on August 12 in early August; the growth style underwent a rapid repair. NVIDIA fell from 225.01 to 208.48 between August 17 and 24, then rebounded to about $213 on August 25; individual stock event risk is higher than index risk.
The equity module does not issue trading signals based on the rise or fall of QQQ or NVIDIA on any single day. The system uses three relative price series:
• QQQ / SPY: growth style relative to the broad market;
• NVDA / QQQ: AI leaders relative to the technology index;
• BTC / QQQ: crypto risk appetite relative to US equity growth style.
The 20-day slope, 60-day correlation, and volatility changes of relative prices jointly determine equity and crypto risk budgets. The three trading days before and after earnings dates are separately marked as event windows, and the model must not treat event gaps as ordinary trend samples.
II. Strategies Eligible for Small-Scale Live Trading
2.1 Strategy Name and Objective
Strategy Name: Gate Cross-Asset Regime Allocation, abbreviated as GCRA.
The strategy frequency is daily decision-making with hourly execution. The observation pool includes BTC, ETH, SOL, SPY, QQQ, NVDA, as well as the corresponding stocks, CFDs, or TradFi Perps accessible in actual Gate accounts. The strategy objective is to capture medium-term trend and cross-asset relative strength returns while controlling the portfolio's annualized target volatility within 10%–12%.
2.2 Daily Run Schedule
• UTC 00:10: Read Gate crypto daily candles, funding rates, OI, and trading volume data;
• 30 minutes after US market close: Update stock data such as SPY, QQQ, NVDA;
• UTC 01:00: Calculate regime probabilities, asset scores, and next-day target risk;
• UTC 01:00–03:00: Execute crypto asset rebalancing;
• 30 minutes after the next US trading day's open: Execute stock or CFD rebalancing;
• Every 15 minutes intraday: Check circuit-breaker conditions; only position reduction, suspension, or continued execution are permitted.
2.3 Market Regime Scoring
RegimeScore = 0.30 × Trend + 0.20 × Breadth + 0.20 × Liquidity + 0.15 × Volatility + 0.15 × Leverage
Each factor is first rolling-standardized within its own market, with the range compressed to -1 to +1. A RegimeScore above 0.35 enters the risk expansion regime; below -0.35 enters the defensive regime; the remaining range uses a neutral budget.

2.4 Asset Signals
Each asset receives a trend score and a crowding score:
TrendScore(i) = 0.35 × Mom20 + 0.25 × Mom60 + 0.20 × ADX + 0.20 × MA_Structure
CrowdingScore(i) = 0.30 × RSI + 0.25 × Funding + 0.25 × LongShortRatio + 0.20 × VolExpansion
FinalSignal(i) = TrendScore(i) − 0.50 × max(CrowdingScore(i), 0)
All inputs are standardized values. Crowding only weakens long signals and does not automatically generate short signals. Shorts require FinalSignal below -0.25, along with three confirmations: price breaking below the 20-day moving average, ADX no longer rising, and OI increasing during the decline.
2.5 Position Sizing Formula
RawWeight(i) = FinalSignal(i) ÷ ForecastVol(i)
ScaledWeight(i) = RawWeight(i) ÷ Σ abs(RawWeight)
PortfolioLeverage = min(1.5, TargetVol ÷ ForecastPortfolioVol)
TargetWeight(i) = ScaledWeight(i) × PortfolioLeverage × RegimeMultiplier
TargetVol defaults to 10%. RegimeMultiplier takes values of 1.00, 0.70, and 0.35 in the risk expansion, neutral, and defensive regimes, respectively. ForecastVol uses the higher of the 10-day and 60-day estimates to prevent position adjustments from being too slow when volatility rises rapidly.
2.6 Live Trading Risk Limits
• Single-asset risk contribution cap: 20%;
• Aggregate crypto asset risk contribution cap: 45%;
• AI industry chain thematic risk contribution cap: 30%;
• Leveraged product margin usage cap: 25% of account equity;
• Single-day portfolio loss reaches 1.5%: Stop adding new positions;
• Single-day portfolio loss reaches 2.5%: Reduce the total risk budget to 35% of normal;
• Rolling 20-day drawdown reaches 6%: Exit all leveraged products and enter model review;
• Actual slippage exceeds predicted slippage by two times: Suspend execution for that product;
• Market data source delay exceeds two decision cycles: Hold or reduce positions; do not generate new positions.
2.7 Example Strategy Output Under Current Data

Note: The above is a model demonstration and does not represent specific trading advice. Formal live trading requires recalculation using the instruments tradable on Gate at that time, real-time costs, and account permissions.
III. Gate Multi-Product Execution Routing

Direct stock access, CFDs, and TradFi Perps cannot be directly interchanged by ticker name. The routing engine calculates the expected holding cost before placing orders:
TotalCost = Fee + Spread + ExpectedSlippage + FundingCost + OvernightCost
NetEdge = ExpectedAlpha − TotalCost
When NetEdge is less than 0.10 times the predicted volatility, cancel the order. This threshold is used to filter out signals with insufficient trading edge and an excessively high cost ratio.
IV. Execution Algorithms and Order Management
4.1 Order Splitting
ImpactEstimate = η × ShortVol × sqrt(OrderSize ÷ AverageDailyVolume)
η is fitted from historical fills. When the order size exceeds 20% of the executable volume of the top five levels of the order book, the system switches to staged limit orders or time-weighted execution. In crypto markets, participation rates are reduced on weekends, during settlement periods, and before macroeconomic data releases; for stocks and CFDs, separate cost parameters are used in the 30 minutes before the open and the 15 minutes before the close.
4.2 Responsibilities of AI at the Execution Layer
• Convert announcements, earnings reports, and macroeconomic events into event categories, direction, duration, and confidence;
• Identify abnormal slippage, market data delays, insufficient account balance, and product trading session conflicts;
• Generate post-trade attribution, distinguishing signal loss, cost loss, and execution deviation;
• Trigger position reduction or suspension, but must not on its own breach position, leverage, and loss limits.
V. Backtesting, Paper Trading, and Live Deployment Process
5.1 Backtest Design
It is recommended to use a rolling window of 24 months for training, 3 months for validation, and 3 months for testing, moving forward every three months. All standardization parameters use only data available at the time. Stock data requires adjusted prices, financial and macroeconomic data retain their first release time, and news models are prohibited from reading retrospective summaries.
Backtests must incorporate commissions, spreads, slippage, funding rates, CFD overnight fees, stock trading sessions, and gaps. When historical order book data is missing, use a volume participation rate model to estimate impact, and run cost stress tests at 1x, 1.5x, and 2x.
5.2 Deployment Thresholds

5.3 Evaluation Metrics
• Annualized return, annualized volatility, maximum drawdown, Calmar, and Sortino;
• Return distribution under different market regimes;
• Pre- and post-cost return difference, turnover, and capacity;
• Rank IC, signal half-life, and probability calibration;
• Stress-period correlations, margin usage, and distance to liquidation;
• Itemized attribution of model return, product selection return, and execution return.
VI. Model Failure and Circuit Breakers
The system monitors input drift, relationship drift, and execution drift. Any of the following conditions triggers model degradation:
• 20-day Rank IC falls below the 10th historical percentile;
• Post-cost return is negative for two consecutive evaluation periods;
• Actual slippage exceeds twice the predicted value for five consecutive times;
• Portfolio correlation is significantly higher than assumed by the stress matrix;
• A single feature contributes more than 50% of the model's total contribution;
• Product rules, trading sessions, or fee structures change.
After degradation, only volatility targeting, risk limits, and position reduction functions are retained, and the forecasting module switches to a linear baseline. Recovery requires completing data checks, parameter review, and new out-of-sample validation.
VII. Conclusion
The weekly trends of BTC, ETH, and SOL remain strong, 7-day volatility has risen relative to 30-day and 90-day levels, and sentiment and positioning crowding are at high levels. The decline in open interest shows that leveraged funds are contracting, and short-term positions should be below normal. In the stock market, SPY has maintained positive returns in recent months, QQQ has recovered after a July drawdown, and NVIDIA has shown large fluctuations ahead of the earnings window. Crypto assets and growth stocks share liquidity and risk appetite factors, and portfolios need to be clustered by risk source.
The GCRA strategy provides a verifiable path to live trading. Daily-frequency regime identification determines the risk budget, trend and crowding dual scores generate asset signals, volatility targeting controls total exposure, correlation limits address cross-market concentration, and Gate product routing compares the net costs of direct stock access, CFDs, TradFi Perps, spot, and perpetual contracts. Intraday AI is responsible for event extraction, execution optimization, and anomaly monitoring, without breaching preset risk boundaries.
References
• Gate TradFi: https://www.gate.com/tradfi
• Gate, https://www.gate.com/zh/help/tradfi/stock-spot/50974
• Gate CFD, https://www.gate.com/zh/learn/articles/what-is-gate-tradfi-cfd-trading
• Invesco QQQ Monthly Review, https://www.invesco.com/qqq-etf/en/etf-insights/qqq-monthly-review.html
Gate Research is a comprehensive blockchain and cryptocurrency research platform that provides readers with in-depth content, including technical analysis, hot insights, market reviews, industry research, trend forecasts, and macroeconomic policy analysis.
Disclaimer
Investing in the cryptocurrency market involves high risk. Users are advised to conduct independent research and fully understand the nature of the assets and products they purchase before making any investment decision. Gate assumes no responsibility for any loss or damage caused by such investment decisions.